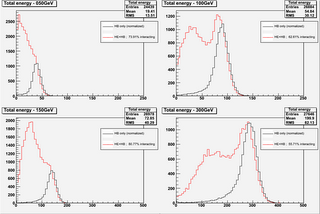
I tried to add the subtraction histo:
It's not perfectly smooth, but it looks somewhat better in the rebinned version (see below -- in this plot the bin width is the same for all the histograms). Probably we need some simulation to understand better these bumps.
In the previous plots the normalization (done with the scaling on the maximum bin) is not correct, i.e. it leads to negative values in the blue histogram. The following one is one with HB-only correctly normalized. Now the normalization is done by comparing the area of the tail on the right side of the max (starting 2sigma far away from the peak).
Thursday, May 18, 2006
interacting/non interacting ratio
I've been trying to get the fraction of pions interacting in HE.
I used this procedure:
- for each event find the cell with max, and sum
the 3x3 cells around it
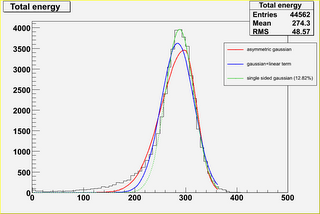
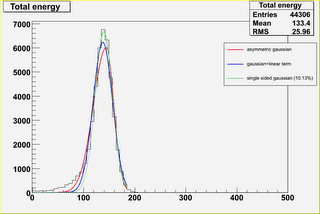
- try to fit the distribution without HE with different
parametrizations (see fits*.png; the percentage reported
in the plot indicates "how much the fit underestimates
the left side of the histogram").
- try to subtract from the histogram relative to HE+HB
the distribution relative to HB alone. I tried to do
this last step in more than one way(raw & parametrization),
but up to now I got the best results (in my opinion...)
by just normalizing the HB-alone distribution to the HE+HB
and then subtracting (the "raw" way - see normRatio.png);
the parametrization has some problem related to the fitting
range (especially for the low energy data).
Monday, April 17, 2006
notes (discussion with prof. Tully)
The sum over 3x3 elements seems to be a standard technique.It seems like cristals for both ECAL and HCAL are build in such a way that the energy deposition is mainly within this volume (5x5 is used only for extreme cases).
The values read from ECAL have to be corrected for the calibration (I don't understand if this issue is more or less complicated for ECAL or HCAL).
Anyway the goal of the epxerimental project should be something like:
The values read from ECAL have to be corrected for the calibration (I don't understand if this issue is more or less complicated for ECAL or HCAL).
Anyway the goal of the epxerimental project should be something like:
- implementing the conversion from raw data to energies within CMSSW
- produce files with the energies, so that if you're interested only in these values you don't have to run the whole CMSSW machinery
- try to see how the e/h correction works
Tuesday, April 04, 2006
\sum E over 3x3
Simple implementation :
The new energy distributionnow looks like this:
the mean value is different from previously (it was 243 -- nominal 300).
- find the element (eta,phi) with maximum energy
- sum the 3x3 elements aroud this one and consider this as the total energy
The new energy distributionnow looks like this:
the mean value is different from previously (it was 243 -- nominal 300).
e/h previous procedure
Information from professor Green:
I enclose the code I used. I hope it is readable. The data sets are 5,7,9,10,15,30,50,100,150, and 300 GeV pions from the 2004 test beam. The data was cleaned up by Jordan Damgov – and he can send you the data sets. I first take out e/pi for the HCAL alone so that e/pi is 1 at infinite energy. Then for fits I use 10, 30, 100 and 300 GeV data . The fit function minimizes chisq. The error I used was ~ the energy resolution.
Saturday, April 01, 2006
documentation links
Wednesday, March 29, 2006
Comments after the first few plots
For these plots:
E in HB (eta,phi)=(7,3) and neighbors:
E_T and E (top/bottom) in HB and HO (left/right):
Total energy distribution (\sum over all eta-phi):
Comments after showing the first few plots to prof. Tully:
- only triggered events selected
- summing the energies for each event (from different directions)
- 811 over 45165 are negative values (usually around -50 but I don't think this number has a specific meaning)
E in HB (eta,phi)=(7,3) and neighbors:
E_T and E (top/bottom) in HB and HO (left/right):
Total energy distribution (\sum over all eta-phi):
Comments after showing the first few plots to prof. Tully:
- plots seem to be correct
- negative values are probably due to events where there was no interaction and the pedestal undergoes to common mode
- it is correct to use E and not E_t
- it is correct to use HB and not HO; HO is the tail catcher and in our case (we are interested mainly in low energies) the energy deposition in HO is negligible
- the \sum over energies doesn't have to be over the whole HCAL; sum only on the 3x3 elements around the beam direction. In this way you should also be able to reduce the number of negative-energy values
- consider more data; ask question jmmans@fnal.gov. His answer:
You can use the run database and also the logbook to find run numbers. (Both are available at
the link above). Once you know the run numbers you are interested in, the data is available
in dcache at FNAL. The dcache directory is /pnfs/cms/WAX/5/pnfs/fnal.gov/TB04. You can dccp
the files from there to your local space, or you can try to run on them directly using
"dcap:/pnfs..." as the filename in HcalTBSource. Not all the releases will work with dcache,
unfortunately, so you may have to use dccp. - Look for useful data at http://cms-testbeamh2.web.cern.ch/cms-testbeamh2/ (be careful, we are interested mainly in low energy pions -- energies are sometime negative?)
- Try to reproduce the "banana plot" (i.e. E_hcal vs E_ecal) that you can find in the note by Dan Green.
- Try to use the same data which he used for that note (it seems to me that in his plots appears a series of pions (500 for each point?) with energies of 5, 7, 9, 10, 11, 12, 14, 100, 105, 120 GeV
Subscribe to:
Posts (Atom)