

I've been trying to get the fraction of pions interacting in HE.
I used this procedure:
- for each event find the cell with max, and sum
the 3x3 cells around it
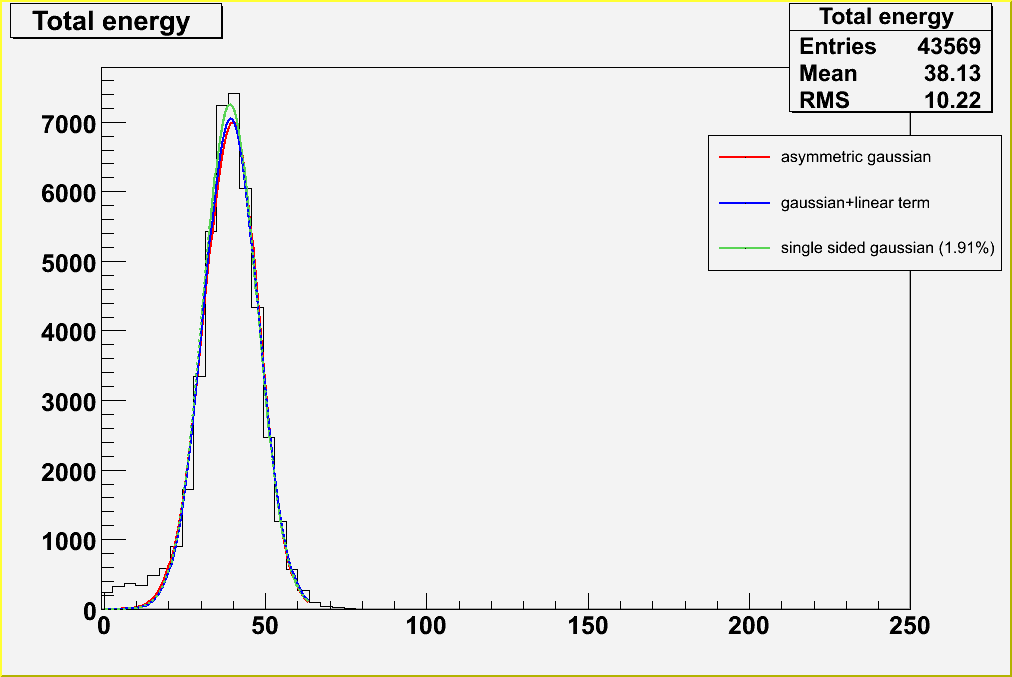
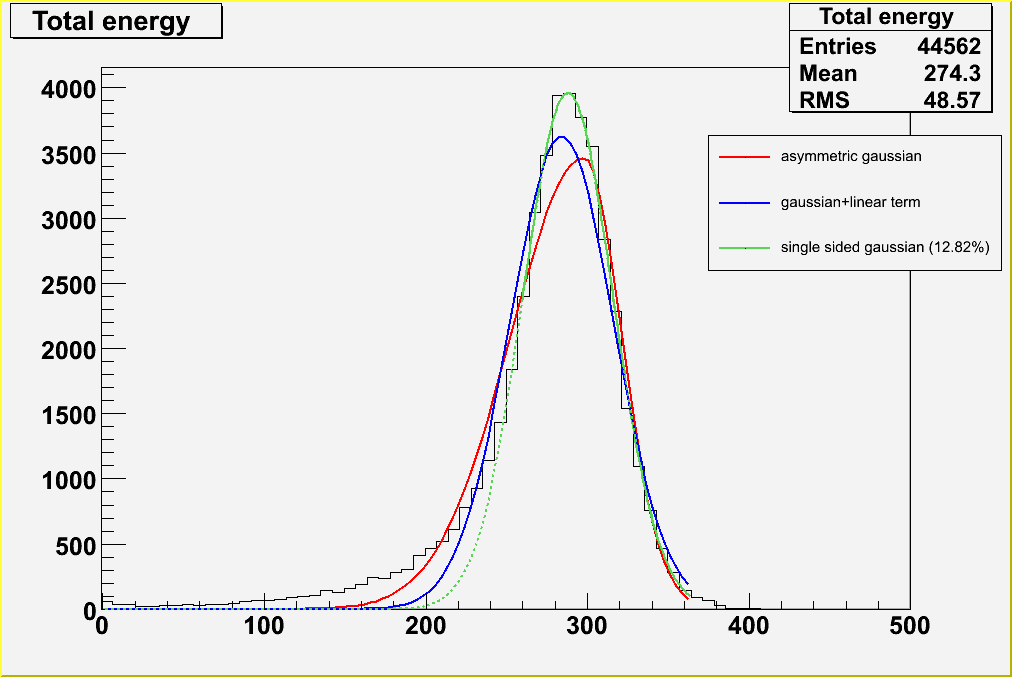
- try to fit the distribution without HE with different
parametrizations (see fits*.png; the percentage reported
in the plot indicates "how much the fit underestimates
the left side of the histogram").
- try to subtract from the histogram relative to HE+HB
the distribution relative to HB alone. I tried to do
this last step in more than one way(raw & parametrization),
but up to now I got the best results (in my opinion...)
by just normalizing the HB-alone distribution to the HE+HB
and then subtracting (the "raw" way - see normRatio.png);
the parametrization has some problem related to the fitting
range (especially for the low energy data).
I used this procedure:
- for each event find the cell with max, and sum
the 3x3 cells around it
- try to fit the distribution without HE with different
parametrizations (see fits*.png; the percentage reported
in the plot indicates "how much the fit underestimates
the left side of the histogram").
- try to subtract from the histogram relative to HE+HB
the distribution relative to HB alone. I tried to do
this last step in more than one way(raw & parametrization),
but up to now I got the best results (in my opinion...)
by just normalizing the HB-alone distribution to the HE+HB
and then subtracting (the "raw" way - see normRatio.png);
the parametrization has some problem related to the fitting
range (especially for the low energy data).

1 comment:
go on with the simple procedure, try to understand the "high energy" data before (the low energy ones are trickier)
try rebinning on the ones with energy range [2,250]; the bin amplitude in principle should be the same for all the histos
try to subtract the (HB only) from (EC+HB) and see whether or not you get smth smooth
start working on a simulation so that we can compare and (hopefully) understand the data
Post a Comment