- only triggered events selected
- summing the energies for each event (from different directions)
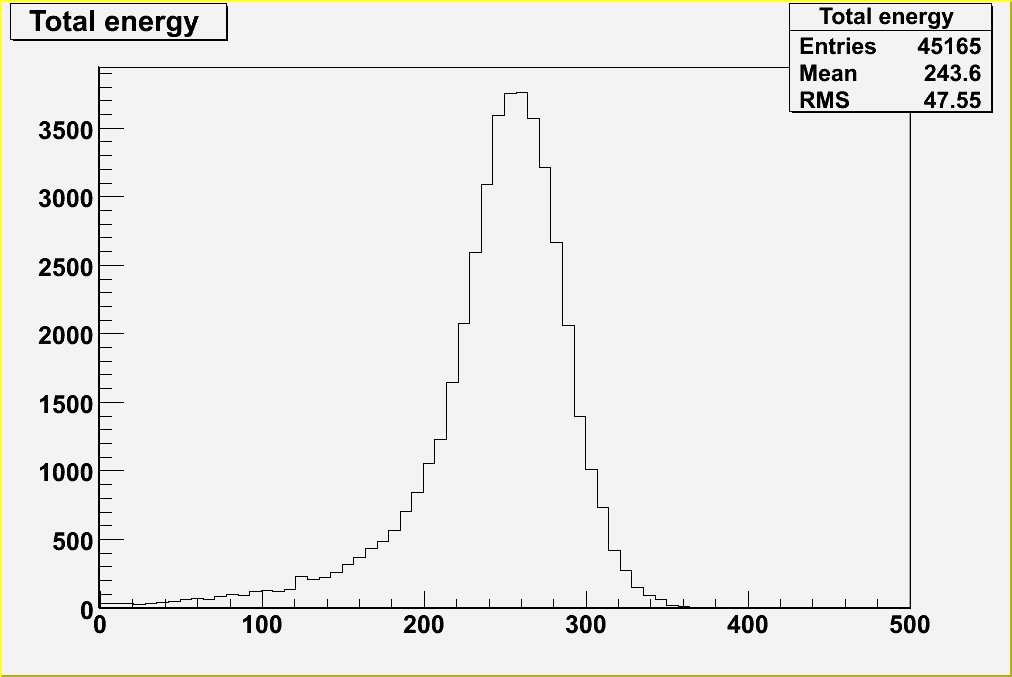
- 811 over 45165 are negative values (usually around -50 but I don't think this number has a specific meaning)
E in HB (eta,phi)=(7,3) and neighbors:

E_T and E (top/bottom) in HB and HO (left/right):

Total energy distribution (\sum over all eta-phi):
Comments after showing the first few plots to prof. Tully:
- plots seem to be correct
- negative values are probably due to events where there was no interaction and the pedestal undergoes to common mode
- it is correct to use E and not E_t
- it is correct to use HB and not HO; HO is the tail catcher and in our case (we are interested mainly in low energies) the energy deposition in HO is negligible
- the \sum over energies doesn't have to be over the whole HCAL; sum only on the 3x3 elements around the beam direction. In this way you should also be able to reduce the number of negative-energy values
- consider more data; ask question jmmans@fnal.gov. His answer:
You can use the run database and also the logbook to find run numbers. (Both  are available at
the link above).  Once you know the run numbers you are  interested in, the data is available
in dcache at FNAL.  The dcache directory  is /pnfs/cms/WAX/5/pnfs/fnal.gov/TB04.  You can dccp
the files from there to  your local space, or you can try to run on them directly using
"dcap:/pnfs..."  as the filename in HcalTBSource.  Not all the releases will work with dcache,
unfortunately, so you may have to use dccp. - Look for useful data at http://cms-testbeamh2.web.cern.ch/cms-testbeamh2/ (be careful, we are interested mainly in low energy pions -- energies are sometime negative?)
- Try to reproduce the "banana plot" (i.e. E_hcal vs E_ecal) that you can find in the note by Dan Green.
- Try to use the same data which he used for that note (it seems to me that in his plots appears a series of pions (500 for each point?) with energies of 5, 7, 9, 10, 11, 12, 14, 100, 105, 120 GeV