Thursday, May 18, 2006

interacting/non interacting ratio (rev.)

I tried to add the subtraction histo:


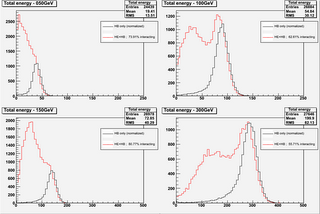
It's not perfectly smooth, but it looks somewhat better in the rebinned version (see below -- in this plot the bin width is the same for all the histograms). Probably we need some simulation to understand better these bumps.


In the previous plots the normalization (done with the scaling on the maximum bin) is not correct, i.e. it leads to negative values in the blue histogram. The following one is one with HB-only correctly normalized. Now the normalization is done by comparing the area of the tail on the right side of the max (starting 2sigma far away from the peak).

interacting/non interacting ratio


I've been trying to get the fraction of pions interacting in HE.
I used this procedure:
- for each event find the cell with max, and sum
the 3x3 cells around it
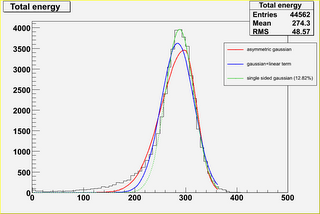
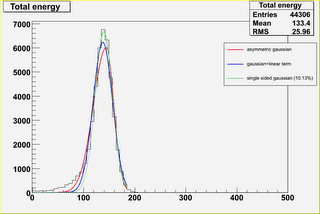
- try to fit the distribution without HE with different
parametrizations (see fits*.png; the percentage reported
in the plot indicates "how much the fit underestimates
the left side of the histogram").

- try to subtract from the histogram relative to HE+HB
the distribution relative to HB alone. I tried to do
this last step in more than one way(raw & parametrization),
but up to now I got the best results (in my opinion...)
by just normalizing the HB-alone distribution to the HE+HB
and then subtracting (the "raw" way - see normRatio.png);
the parametrization has some problem related to the fitting
range (especially for the low energy data).